
Datasets

4-month long 101-ensemble member seasonal attribution experiment (I98_BC20) initialised on 01-November-2019 using the atmosphere-only version of SEAS5 (see Johnson et al., 2019) forced with daily ERA5 SST as in the reference experiment (R20) but with daily SST over the tropical Indian Ocean swapped with that from 2019/20.
Examples
Interval/period: N/A
4-month long 101-ensemble member seasonal attribution experiment (I16_BC20) initialised on 01-November-2019 using the atmosphere-only version of SEAS5 (see Johnson et al., 2019) forced with daily ERA5 SST as in the reference experiment (R20) but with daily SST over the tropical Indian Ocean swapped with that from 2019/20.
Examples
Interval/period: N/A
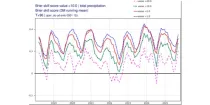
These diagrams show Brier Skill Scores (BSS) for two parameters at several forecast lead-times ...
Interval/period: N/A
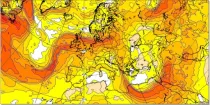
Bulk Wind Shear charts show the scalar value of the shear between the winds at the two pressure levels selected. Shear can be useful in assessing the strength of a front or...
Interval/period: N/A
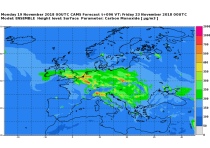
This dataset provides daily air quality analyses and forecasts for Europe.
Interval/period: N/A
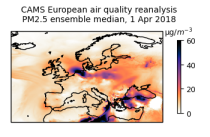
This dataset provides annual air quality reanalyses for Europe based on both unvalidated (interim) and validated observations.
Interval/period: N/A
CAMS atmospheric composition forecast experiment set up to explore data information content in the scope of a ESoWC project. The data is encoded as IEEE single-precision (32-bit floats) circumventing any other lossy compression. This is in contrast to the default 24-bit linear packing used for CAMS in the ECMWF data archive and on the Copernicus Atmosphere Data Store. Explanation of parameter ids can be found at: https://apps.ecmwf.int/codes/grib/param-db/
Examples
Interval/period: N/A

Interval/period: N/A
Interval/period: N/A
Interval/period: N/A
Interval/period: N/A
Interval/period: N/A
Interval/period: N/A
Interval/period: N/A
Interval/period: N/A
Interval/period: N/A
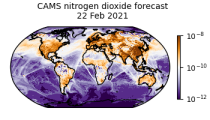
CAMS produces global forecasts for atmospheric composition twice a day. The forecasts consist of more than 50 chemical species (e.g. ozone, nitrogen dioxide, carbon monoxide) and seven different types of aerosol (desert dust, sea salt, organic matter, black carbon, sulphate, nitrate and ammonium aerosol). In addition, several meteorological variables are available as well.
Interval/period: N/A
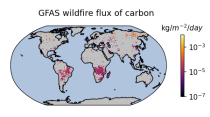
Emissions of atmospheric pollutants from biomass burning and vegetation fires are key drivers of the evolution of atmospheric composition, with a high degree of spatial and temporal variability, and an accurate representation of them in models is essential.
Interval/period: N/A
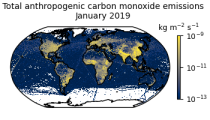
This data set contains gridded distributions of global anthropogenic and natural emissions.
Interval/period: N/A
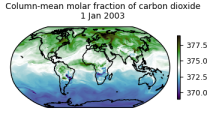
This dataset is part of the ECMWF Atmospheric Composition Reanalysis focusing on long-lived greenhouse gases: carbon dioxide (CO2) and methane (CH4). The emissions and natural fluxes at the surface are crucial for the evolution of the long-lived greenhouse gases in the atmosphere. In this dataset the CO2 fluxes from terrestrial vegetation are modelled in order to simulate the variability across a wide range of scales from diurnal to inter-annual.
Interval/period: N/A
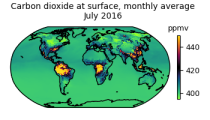
This dataset is part of the ECMWF Atmospheric Composition Reanalysis focusing on long-lived greenhouse gases: carbon dioxide (CO2) and methane (CH4). The emissions and natural fluxes at the surface are crucial for the evolution of the long-lived greenhouse gases in the atmosphere. In this dataset the CO2 fluxes from terrestrial vegetation are modelled in order to simulate the variability across a wide range of scales from diurnal to inter-annual.
Interval/period: N/A
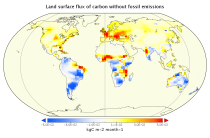
This data set contains net fluxes at the surface, atmospheric mixing ratios at model levels, and column-mean atmospheric mixing ratios for carbon dioxide (CO2), methane (CH4) and nitrous oxide (N20).
Interval/period: N/A

A routine inter-comparison of wave model forecast verification data was first established in 1995, developed around the exchange of model forecast data at an agreed list of moored buoy sites at which instrumented observations of significant wave height, wave period and wind speed are available over the WMO GTS.
Interval/period: N/A
(Next AIFS version v2) AIFS ENS Meteograms show a probabilistic interpretation of the AIFS ENS forecasts for specific locations using a box and whisker plot. It shows the time evolution of the distribution of several meteorological parameters on a single diagram...
Interval/period: N/A
This product shows ENS meteograms from next model version of IFS cycle 50R1 that is planned to be ...
Interval/period: N/A