Datasets

Interval/period: N/A
Interval/period: N/A
Interval/period: N/A
Interval/period: N/A
Interval/period: N/A
Interval/period: N/A
Interval/period: N/A
Interval/period: N/A
Seasonal 7-month forecast (SEAS), V-ii-b: Monthly mean anomalies of ensemble means - Pressure levels
Interval/period: N/A
Interval/period: N/A
Interval/period: N/A
Interval/period: N/A
Interval/period: N/A
Interval/period: N/A
Interval/period: N/A
Interval/period: N/A
Interval/period: N/A
Interval/period: N/A
Interval/period: N/A

Seasonal forecast using CY49R2b with stochastic sea ice scheme active. Used to support the analysis in the paper titled "The impact of stochastic sea ice perturbations on seasonal forecasts" submitted to Weather and Climate Dynamics by K. Strommen, M. Mayer, J. Spaeth and S. Tietsche. Further details in the paper. This forecast can be directly compared against the control counterpart "ikh7".
Examples
Interval/period: N/A
Seasonal forecast using CY49R2b without any stochastic sea ice scheme active. Used to support the analysis in the paper titled "The impact of stochastic sea ice perturbations on seasonal forecasts" submitted to Weather and Climate Dynamics by K. Strommen, M. Mayer, J. Spaeth and S. Tietsche. Further details in the paper. This control forecast can be directly compared to the forecast "imsu", which has stochastic sea ice schemes turned on.
Examples
Interval/period: N/A
The seasonal run (Nov 2018 - Feb 2019) performed on the Oak Ridge Summit supercomputer with a 1.4 km spatial resolution and a 3 hour temporal resolution. Currently only the initial 10 steps have been published as an example, but more data is available on request. Surface fields are available for the entire time range, model level and pressure level fields are available for only the first month. Model levels 1 to 137 are available. Pressure levels 1, 2, 3, 5, 7, 10, 20, 30, 50, 70, 100, 150, 200, 250, 300, 400, 500, 700, 850, 925, 1000 are available.
Interval/period: N/A
This is an global forecast experiment for ALaDyn
Examples
retrieve, class=rd, stream=oper, expver=iglm, type=fc, levtype=sfc, param=2t, date=2000-01-01, time=00:00:00, step=24, target='output.grib'Retrieving 2m-temperature at step 24
retrieve, class=rd, stream=oper, expver=iglm, type=fc, levtype=sfc, param=pr, date=2000-01-01, time=00:00:00, step=1/2/3/4, target='output.grib'Retrieving accumulated total precipitation at steps 1 to 4
Interval/period: N/A
Standalone wave model CY47R1 forced by ERA5 hourly neutral 10m winds, air density, gustiness and sea ice fraction. Native grid is Tco639 (18km), 36 directions, 37 frequencies. No wave data assimilation. Hourly output, including 2d spectra.
Examples
Interval/period: N/A
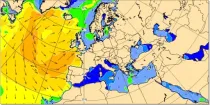
At any location over the oceans, there is a spectrum of waves which describes how much wave energy is present for given wave frequencies and direction of propagation...
Interval/period: N/A